Vehicle-to-Vehicle (V2V) Communication Analysis
#automotive #programming #data-analysisThis was a recent small freelance job. The requirement was to analyze some vehicle position data from an urban area for Vehicle-to-Vehicle (V2V) communication. Some background on V2V Communication can be found here. The analysis was done in MATLAB.
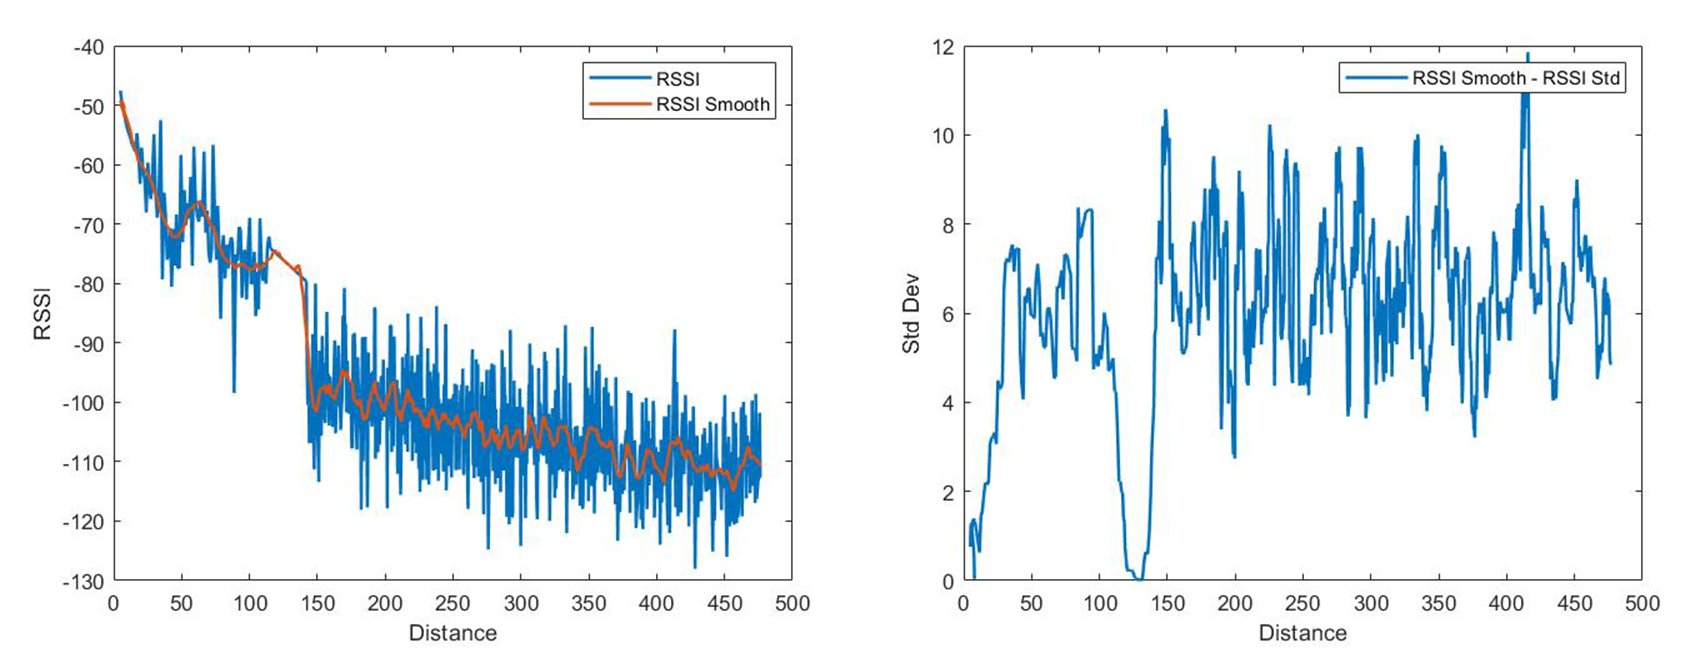
The client was interested in the relationship of RSSI (a common measure of signal strength) vs vehicle distance to investigate the threshold within which the signal can be considered reliable. A smoothened version of the signal is made using a Savitzsky-Golay filter. A significant drop in RSSI is seen around 125 m where there is a lack of data.
 Received Signal Strength Indicator vs. Distance & Standard Deviation vs. Distance
With input from the client 300 m was chosen as the threshold of interest. The routine below was ran to find the number and ID of cars that were within 300 m for each car in the dataset:
1
2
3
4
5
6
7
8
9
10
11
12
13
14
15
16
17
18
19
20
21
22
23
24
25
26
27
28
29
30
31
32
33
34
35
36
37
38
39
40
41
42
43
44
45
46
    %% DETERMINE DISTANCES
    DistStruct = struct; % Structure to hold calculated distances

    %For each car make an array definining which others are within 300 m
    for iCars = 1:length(VehicleID) %Loop thru cars
        %Find info of current car
        CarID = VehicleID(iCars);
        CarX = XData(iCars);
        CarY = YData(iCars);

        %Find info of all other cars
        OtherCarsID = VehicleID;
        OtherCarsID(iCars) = []; %Remove entry of current car
        OtherCarsX = XData;
        OtherCarsY = YData;
        OtherCarsX(iCars) = []; %Remove entry of current car
        OtherCarsY(iCars) = []; %Remove entry of current car

        %Initialize arrays for dist calc
        XDist = NaN.*ones(length(OtherCarsID),1);
        YDist = NaN.*ones(length(OtherCarsID),1);
        TotalDist = NaN.*ones(length(OtherCarsID),1);
        Threshold = NaN.*ones(length(OtherCarsID),1);

        for iCars2 = 1:length(OtherCarsID) %Loop thru all other cars to evaluate against current car
            XDist(iCars2) = CarX - OtherCarsX(iCars2);
            YDist(iCars2) = CarY - OtherCarsY(iCars2);
            TotalDist(iCars2) = sqrt(XDist(iCars2).^2 + YDist(iCars2).^2);

            if TotalDist(iCars2) < 300 %Check which distances are withing 300 m threshold and store in array
                Threshold(iCars2) = true;
            else
                Threshold(iCars2) = false;
            end
        end

        ThresholdNum = nnz(Threshold); %Number of vehicles within 300 m of current one

        %Assign data into struct which stores data for each car
        DistStruct(iCars).ID = CarID; %ID of current car
        DistStruct(iCars).OtherIDs = OtherCarsID; %ID of all other cars
        DistStruct(iCars).Distances = TotalDist; %Distances between current car and other cars
        DistStruct(iCars).Threshold = Threshold; %Array of which other cars are within 300 m
        DistStruct(iCars).ThresholdNum = ThresholdNum; %Number of total cars within 300 m of this car
    end
From this analysis further plots were made. First, the distribution for number of vehicles within 300 m, to show how many vehicles are commonly within range.
 Histogram Showing Number of Vehicles Within Range
Second, a geographic map with the position of each car colored by how many others are within range. It can be seen that cars in the condensed streets around the middle of the map have the most other cars in range:
1
2
3
4
5
6
7
8
9
10
11
12
13
14
15
16
17
18
19
20
21
22
23
24
25
26
27
28
29
30
31
32
33
34
35
36
37
38
39
40
41
    %--------------------------------------------------------------------------------%
    % X-Y PLOT
    %Make X-Y plot of all vehicle positions (not requested but just want to
    %see what the data looks like)
    Title = 'Vehicle X-Y Positions';
    FIGS.XY = figure('Name',Title, ...
        'NumberTitle','off','units','normalized','outerposition',[0,0,1,1],'Color',BackColor);

    AX = axes(FIGS.XY);

    %Make array of how many vehicles are within 300 for each vehicle (cant plot
    %directly from struct)
    ThresholdData = [];
    for i = 1:1:length(VehicleID)
        ThresholdData(i) = DistStruct(i).ThresholdNum;
    end

    %Plot
    scatter(AX,XData,YData,10,ThresholdData,'filled')

    %Axes properties
    AX.Color = BackColor;
    AX.XAxis.Exponent = 0;
    AX.YAxis.Exponent = 0;
    AX.XColor = ForeColor;
    AX.YColor = ForeColor;
    AX.XGrid = 'on';
    AX.YGrid = 'on';
    AX.XMinorGrid = 'on';
    AX.YMinorGrid = 'on';
    AX.Title.String = Title;
    AX.Title.Color = ForeColor;
    AX.Colormap = jet;
    AX.XLabel.String = 'X Position (m)';
    AX.YLabel.String = 'Y Position (m)';

    CB = colorbar(AX);
    CB.Label.String = sprintf('Number of Vehicles Within 300 m');
    CB.Label.Interpreter = 'none';
    CB.Color = ForeColor;
 Geographic Colormap for Number of Vehicles Within Range